Sunday, 14 September 2014
Geophysicists Detect Evidence of Large Amounts of Water in Earth’s Mantle
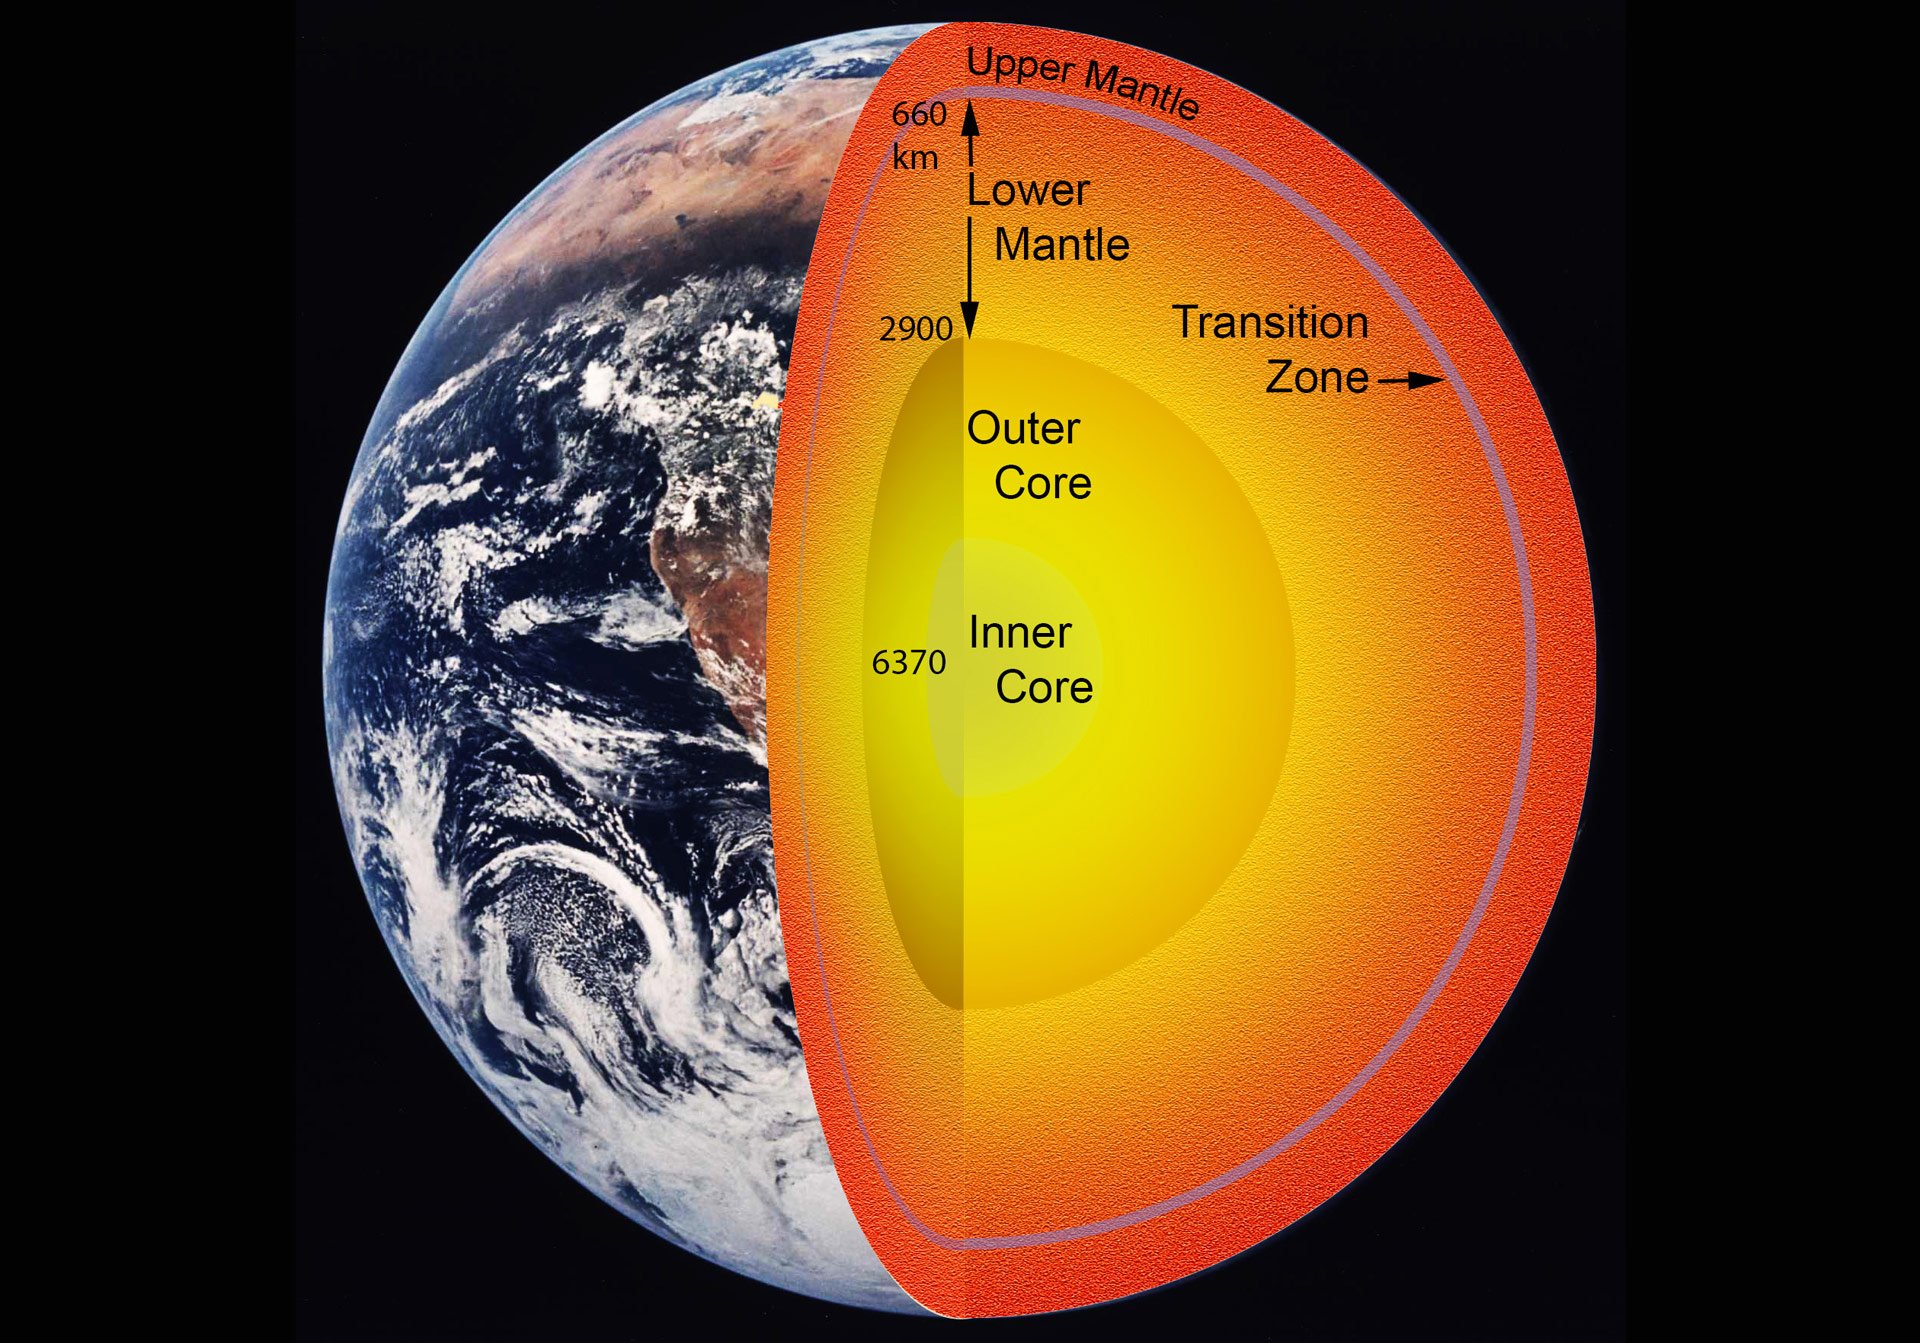
Schematic cross section of the Earth’s interior highlighting the transition zone layer (light blue, 410-660 km depth), which has an anomalously high water storage capacity. The study by Schmandt and Jacobsen used seismic waves to detect magma generated near the top of the lower mantle at about 700 km depth. Dehydration melting at those conditions, also observed in the study’s high-pressure experiments, suggests the transition zone may be nearly saturated with H2O dissolved in high-pressure rock. Image Credit: Steve Jacobsen/Northwestern University
New research reveals large quantities of water bound up in the rock located deep in the Earth’s mantle.
Researchers have found evidence of a potential “ocean’s worth” of water deep beneath the United States.
Although not present in a familiar form, the building blocks of water are bound up in rock located deep in the Earth’s mantle, and in quantities large enough to represent the largest water reservoir on the planet, according to the research.
For many years, scientists have attempted to establish exactly how much water may be cycling between the Earth’s surface and interior reservoirs through the action of plate tectonics. Northwestern University geophysicist Steve Jacobsen and University of New Mexico seismologist Brandon Schmandt have found deep pockets of magma around 400 miles beneath North America — a strong indicator of the presence of H₂O stored in the crystal structure of high-pressure minerals at these depths.
“The total H₂O content of the planet has long been among the most poorly constrained ‘geochemical parameters’ in Earth science. Our study has found evidence for widespread hydration of the mantle transition zone,” says Jacobsen.
For at least 20 years geologists have known from laboratory experiments that the Earth’s transition zone — a rocky layer of the Earth’s mantle located between the lower mantle and upper mantle, at depths between 250 and 410 miles — can, in theory, hold about 1 percent of its total weight as H₂O, bound up in minerals called wadsleyite and ringwoodite. However, as Schmandt explains, up until now it has been difficult to figure out whether that potential water reservoir is empty, as many have suggested, or not.
If there does turn out to be a substantial amount of H₂O in the transition zone, then recent laboratory experiments conducted by Jacobsen indicate there should be large quantities of what he calls “partial melt” in areas where mantle flows downward out of the zone. This water-rich silicate melt is molten rock that occurs at grain boundaries between solid mineral crystals and may account for about 1 percent of the volume of rocks.
“Melting occurs because hydrated rocks are carried from the transition zone, where the rocks can hold lots of H₂O, downward into the lower mantle, where the rocks cannot hold as much H₂O. Melting is the way to get rid of the H₂O that won’t fit in the crystal structure present in the lower mantle,” says Jacobsen.
He adds:
“When a rock starts to melt, whatever H₂O is bound in the rock will go into the melt right away. So the melt would have much higher H₂O concentration than the remaining solid. We’re not sure how it got there. Maybe it’s been stuck there since early in Earth’s history or maybe it’s constantly being recycled by plate tectonics.”
Seismic Waves
Melt strongly affects the speed of seismic waves — the acoustic-like waves of energy that travel through the Earth’s layers as a result of an earthquake or explosion. This is because stiff rocks, like the silicate-rich ones present in the mantle, propagate seismic waves very quickly. According to Schmandt, if just a little melt — even 1 percent or less — is added between the crystal grains of such a rock it causes it to become less stiff, meaning that elastic waves propagate more slowly.
“We were able to analyze seismic waves from earthquakes to look for melt in the mantle just beneath the transition zone,” says Schmandt.
“What we found beneath the U.S. is consistent with partial melt being present in areas of downward flow out of the transition zone. Without the presence of H₂O, it is very difficult to explain melting at these depths. This is a good hint that the transition zone H₂O reservoir is not empty, and even if it’s only partially filled that could correspond to about the same mass of H₂O as in Earth’s oceans,” he adds.
Jacobsen and Schmandt hope that their findings, published in the June issue of the journal Science, will help other scientists to understand how the Earth formed and what its current composition and inner workings are, as well as establish how much water is trapped in mantle rock.
“I think we are finally seeing evidence for a whole-Earth water cycle, which may help explain the vast amount of liquid water on the surface of our habitable planet. Scientists have been looking for this missing deep water for decades,” says Jacobsen
Mantle Rock Studies
The study combined Schmandt’s analysis of seismic data from the USArray, a network of over 2,000 seismometers across the U.S., with Jacobsen’s laboratory experiments, in which he examined the behavior of mantle rock under conditions designed to simulate the high pressures and temperatures present at 400 miles below the Earth’s surface.

Schematic representation of seismometers placed in the US-Array between 2004 and 2014 and used in the study by Schmandt and Jacobsen to detect dehydration melting at the top of the lower mantle beneath North America. Image Credit: NSF-Earthscope
The USArray is part of Earthscope, a program sponsored by National Science Foundation. Jacobsen’s experiments were conducted at two Department of Energy user facilities, the Advanced Photon Source of Argonne National Laboratory and the National Synchrotron Light Source at Brookhaven National Laboratory.
Taken as a whole, their findings produced strong evidence that melting may occur about 400 miles deep in the Earth, with H₂O stored in mantle rocks, such as those containing the mineral ringwoodite, which is likely to be a dominant mineral at those depths.
Schmandt explains that he made this discovery after carrying out seismic imaging of the boundary between the transition zone and lower mantle. He found evidence that, in areas where “sharp transitions” like melt are present, some earthquake energy had converted from a compressional, or longitudinal wave, to a shear or S-wave. The phase of the converted S-waves in areas where the mantle is flowing down and out of the transition zone indicated a significantly lower velocity than surrounding mantle. The discovery suggests that water from the Earth’s surface can be driven to such great depths by plate tectonics, eventually resulting in the partial melting of the rocks found deep in the mantle.
“We used many seismic wave conversions to see that many areas beneath the U.S. may have some melt just beneath the transition zone. The next step was comparing these areas to the areas where mantle flow models predict downward flow out of the transition zone,” says Schmandt.
Ringwoodite
Schmandt and Jacobsen’s findings build on a discovery reported in March in the journal Nature in which scientists discovered a piece of the blue mineral ringwoodite inside a diamond brought up from a depth of 400 miles by a volcano in Brazil. That tiny piece of ringwoodite — the only sample we have from within the Earth — contained a surprising amount of water bound in solid form in the mineral.
“Not only was this the first terrestrial ringwoodite ever seen — all other natural ringwoodite examples came from shocked meteorites — but the tiny inclusion of ringwoodite was also full of H₂O, to about 1.5 percent of total weight,” says Jacobsen. “This is about the maximum amount of water that we are able to put into ringwoodite in laboratory experiments.”
Although the discovery provided direct evidence of water in the deep mantle at about 700 kilometers (434 miles) deep, the diamond sampled only one point of the mantle. Jacobsen explains that the paper expands the search to question how widespread hydration might be throughout the entire transition zone. This is important because the presence of H₂O in the large volumes of rock found at depths of between 410 to 660 kilometers (255 to 410 miles) would “significantly alter our understanding of the composition of the Earth.”

Crystals of laboratory-grown hydrous ringwoodite, a high-pressure polymorph of olivine that is stable from about 520-660 km depth in the Earth’s mantle. The ringwoodite pictured here contains around one weight percent of H2O, similar to what was inferred in the seismic observations made by Schmandt and Jacobsen. Image Credit: Steve Jacobsen/Northwestern University
“It would double or triple the known amount of H₂O in the bulk Earth. Just 1 to 2 percent H₂O by weight in the transition zone would be equivalent to 2 to 3 times the amount of H₂O in the oceans,” adds Jacobsen.
Big Questions
Looking ahead, Jacobsen admits that some big questions remain. For example, if the transition zone is full of H₂O, what does this tell us about the origin of Earth’s water? And is the presence of ringwoodite in a planet’s mantle necessary for a planet to retain enough original water to form oceans? Moreover, how is the H₂O in the transition zone connected to the surface reservoirs? Is the transition zone, if it contains a geochemical reservoir of H₂O larger than the oceans, somehow buffering the amount of liquid water on the Earth’s surface?
“An analogy could be that of a sponge, which needs to be filled before liquid water can be supported on top. Was water in the transition zone added through plate tectonics early in Earth’s history, or did the oceans de-gas from the mantle until an equilibrium was reached between surface and interior reservoirs?” asks Jacobsen.
Either way, the research is likely to be of strong interest to astrobiologists largely because water is often so closely linked to the formation of biological life. Remote geochemical analysis could be one way of detecting if such processes occur elsewhere in the universe, and it is likely that such analysis would involve the use of gamma-ray, neutron, and x-ray spectrometers of the type used by the NASA MESSENGER spacecraft for the remote geochemical mapping of Mercury.
“On other hard to reach planets it’s not practical to apply the type of seismic imaging that I used. So my guess is that geochemical analysis of volcanic rocks from other planetary bodies may be our best way to test whether volatiles are stored in the planet’s interior,” says Schmandt.
Kepler Data Helps Pinpoint ‘Venus Zone’ Around Stars
Astronomers Pinpoint Venus Zone Around Stars
Despite being similarly sized, Earth (represented by the right-half of this image) and Venus (represented by the left half), have vastly different surface conditions. Credit: NASA/JPL-Caltech/Ames
Using data from the Kepler Space Telescope, astronomers have defined the inner and outer edges of the “Venus Zone” – the point at which a planet’s atmosphere would experience runaway greenhouse-gas effects like those seen on Venus.
San Francisco State University astronomer Stephen Kane and a team of researchers presented today the definition of a “Venus Zone,” the area around a star in which a planet is likely to exhibit the unlivable conditions found on the planet Venus.
The research will help astronomers determine which planets discovered with NASA’s Kepler telescope — which has a primary mission of finding habitable planets similar to Earth — are actually more analogous to Earth’s similarly-sized sister planet. Knowing how common Venus-like planets are elsewhere will also help astronomers understand why Earth’s atmosphere evolved in ways vastly different from its neighbor.
“We believe the Earth and Venus had similar starts in terms of their atmospheric evolution,” said Kane, an assistant professor of physics and astronomy at SF State and lead author of the study published online today. “Something changed at one point, and the obvious difference between the two is proximity to the Sun.”
San Francisco State University astronomer Stephen Kane defines the “Venus Zone,” an area around a star in which a planet is likely to exhibit the unlivable conditions found on the planet Venus.
The Kepler telescope is used to find planets outside our solar system, called exoplanets, located within or near the habitable zone in which a planet can hold liquid water on its surface. Earlier this year, Kane was part of an international team of researchers that discovered one such planet orbiting the dwarf star Kepler-186. The main way this search is conducted, however, is by looking for exoplanets that are roughly the same size as Earth. That, according to Kane, poses a problem because our own solar system contains two planets of the same size — Earth and Venus — that have vastly different atmospheric and surface conditions.
“The Earth is Dr. Jekyll and Venus is Mr. Hyde, and you can’t distinguish between the two based only on size,” said Kane, who runs a website tracking known exoplanets. “So the question then is how do you define those differences, and how many ‘Venuses’ is Kepler actually finding?”
Kane and his fellow researchers at Penn State University and the NASA Goddard Space Flight Center in Maryland used “solar flux” — or the amount of a star’s energy that a planet receives — to define the inner and outer edges of the Venus Zone. The point at which a planet’s atmosphere would experience runaway greenhouse-gas effects like those seen on Venus — a point located just inside Earth’s orbit in our solar system — forms the outer boundary. The point at which the planet’s atmosphere would be completely eroded away by the stellar energy marks the inner boundary.
Kepler Data Pinpoint Venus Zone Around Stars
This graphic shows the location of the “Venus Zone,” the area around a star in which a planet is likely to exhibit atmospheric and surface conditions similar to the planet Venus. Credit: Chester Harman, Pennsylvania State University
If Kepler astronomers discover a planet that is similar in size to Earth but located within the solar-flux range that makes up the Venus Zone, that could be a clue the planet is more like Venus than Earth, and therefore is uninhabitable. Future space-based telescopes will allow researchers to begin receiving data on these exoplanets’ atmospheres, helping them confirm whether they are “Venuses” or “Earths.”
“If we find all of these planets in the Venus Zone have a runaway greenhouse-gas effect, then we know that the distance a planet is from its star is a major determining factor,” Kane added. “That’s helpful to understanding the history between Venus and Earth.”
Future research will look at whether the amount of carbon in a planet’s atmosphere impacts the boundaries of the Venus Zone, for example by pushing the outer boundary farther away from the star for planets with greater concentrations of carbon.
“This is ultimately about putting our solar system in context,” according to Kane. “We want to know if various aspects of our solar system are rare or common.”
“On the frequency of potential Venus analogs from Kepler data” by Stephen R. Kane, Ravi Kumar Kopparapu and Shawn D. Domagal-Goldman has been accepted for publication in an upcoming issue of the Astrophysical Journal Letters.
Graphene Paint Makes Impermeable and Chemically Resistant Coatings

Photograph demonstrating water permeation through a brick (~20 cm long) with and without VC-RGO coating. Brick without the graphitic coating rapidly absorbs water but it can stay on top of the VC-RGO coated part for many hours. Credit:Y. Su, et al. doi:10.1038/ncomms5843
New research from the University of Manchester demonstrates how a thin layer of graphene paint can make impermeable and chemically resistant coatings, which could be used for packaging to keep food fresh for longer and protect metal structures against corrosion.
The surface of graphene, a one atom thick sheet of carbon, can be randomly decorated with oxygen to create graphene oxide; a form of graphene that could have a significant impact on the chemical, pharmaceutical and electronic industries. Applied as paint, it could provide an ultra-strong, non-corrosive coating for a wide range of industrial applications.
Graphene oxide solutions can be used to paint various surfaces ranging from glass to metals to even conventional bricks. After a simple chemical treatment, the resulting coatings behave like graphite in terms of chemical and thermal stability but become mechanically nearly as tough as graphene, the strongest material known to man.
The team led by Dr Rahul Nair and Nobel laureate Sir Andre Geim demonstrated previously that multilayer films made from graphene oxide are vacuum tight under dry conditions but, if expose to water or its vapor, act as molecular sieves allowing passage of small molecules below a certain size. Those findings could have huge implications for water purification.
This contrasting property is due to the structure of graphene oxide films that consist of millions of small flakes stacked randomly on top of each other but leave nano-sized capillaries between them. Water molecules like to be inside these nanocapillaries and can drag small atoms and molecules along.
In an article published in Nature Communications this week, the University of Manchester team shows that it is possible to tightly close those nanocapillaries using simple chemical treatments, which makes graphene films even stronger mechanically as well as completely impermeable to everything: gases, liquids or strong chemicals. For example, the researchers demonstrate that glassware or copper plates covered with graphene paint can be used as containers for strongly corrosive acids.
The exceptional barrier properties of graphene paint have already attracted interest from many companies who now collaborate with The University of Manchester on development of new protective and anticorrosion coatings.
Dr Nair said “Graphene paint has a good chance to become a truly revolutionary product for industries that deal with any kind of protection either from air, weather elements or corrosive chemicals. Those include, for example, medical, electronics and nuclear industry or even shipbuilding, to name but the few.”
Dr Yang Su, the first author in this work added: “Graphene paint can be applied to practically any material, independently of whether it’s plastic, metal or even sand. For example, plastic films coated with graphene could be of interest for medical packaging to improve shelf life because they are less permeable to air and water vapor than conventional coatings. In addition, thin layers of graphene paint are optically transparent.”
High-Resolution Images Reveal Surface of Comet 67P/Churyumov-Gerasimenko

In this view of the “belly” and part of the “head” of the comet, several morphologically different regions are indicated. ESA/Rosetta/MPS for OSIRIS Team MPS/UPD/LAM/IAA/SSO/INTA/UPM/DASP/IDA
High-Resolution images taken by OSIRIS reveal a detailed scientific description of the surface of comet 67P/Churyumov-Gerasimenko.
High-resolution images of comet 67P/Churyumov-Gerasimenko reveal a unique, multifaceted world. ESA’s Rosetta spacecraft arrived at its destination about a month ago and is currently accompanying the comet as it progresses on its route toward the inner solar system. Scientists have now analyzed images of the comet’s surface taken by OSIRIS, Rosetta’s scientific imaging system, and allocated several distinct regions, each of which is defined by special morphological characteristics. This analysis provides the basis for a detailed scientific description of 67P’s surface.
“Never before have we seen a cometary surface in such detail”, says OSIRIS Principal Investigator Holger Sierks from the Max Planck Institute for Solar System Science in Germany. In some of the images, one pixel corresponds to 75 centimeters scale on the nucleus. “It is a historic moment, we have an unprecedented resolution to map a comet,” he adds.
With areas dominated by cliffs, depressions, craters, boulders or even parallel grooves, 67P displays a multitude of different terrains. While some of these areas appear to be quiet, others seem to be shaped by the comet’s activity. As OSIRIS images of the comet’s coma indicate, the dust that 67P casts into space is emitted there.
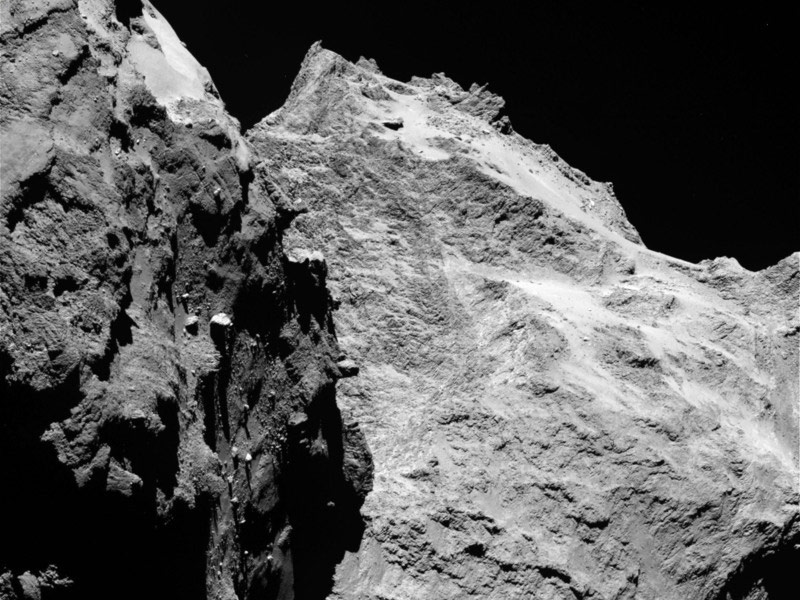
Jagged cliffs and prominent boulders: In this image, several of 67P’s very different surface structures become visible. The left part of the images shows the side wing of the comet’s “body”, while the right is the back of its “head”. The image was taken by OSIRIS, Rosetta’s scientific imaging system, on September 5th, 2014 from a distance of 62 kilometers. One pixel corresponds to 1.1 meters. Credit: ESA/Rosetta/MPS for OSIRIS Team MPS/UPD/LAM/IAA/SSO/INTA/UPM/DASP/IDA
“This first map is, of course, only the beginning of our work,” says Sierks. “At this point, nobody truely understands, how the morphological variations we are currently witnessing came to be.” As both 67P and Rosetta travel closer to the Sun in the next months, the OSIRIS team will monitor the surface looking for changes. While the scientists do not expect the borderlines of the comet’s regions to vary dramatically, even subtle transformations of the surface may help to explain how cometary activity created such a breathtaking world. The maps will also offer valuable insights for Rosetta’s Lander Team and the Rosetta orbiter scientists to determine a primary and backup landing site from the earlier preselection of five candidates.
New Guidelines for the Search for Alien Life on Other Planets

Left: Ozone molecules in a planet’s atmosphere could indicate biological activity, but ozone, carbon dioxide and carbon monoxide — without methane, is likely a false positive. Right: Ozone, oxygen, carbon dioxide and methane — without carbon monoxide, indicate a possible true positive. Image Credit: NASA
Using an altitude-dependent photochemical model with the enhanced lower boundary conditions necessary to carefully explore abiotic oxygen and ozone production on lifeless planets with a wide variety of volcanic gas fluxes and stellar energy distributions, scientists at NASA have developed new guidelines for the search for life on other planets.
Astronomers searching the atmospheres of alien worlds for gases that might be produced by life can’t rely on the detection of just one type, such as oxygen, ozone, or methane, because in some cases these gases can be produced non-biologically, according to extensive simulations by researchers in the NASA Astrobiology Institute’s Virtual Planetary Laboratory.
The researchers carefully simulated the atmospheric chemistry of alien worlds devoid of life thousands of times over a period of more than four years, varying the atmospheric compositions and star types. “When we ran these calculations, we found that in some cases, there was a significant amount of ozone that built up in the atmosphere, despite there not being any oxygen flowing into the atmosphere,” said Shawn Domagal-Goldman of NASA’s Goddard Space Flight Center in Greenbelt, Maryland. “This has important implications for our future plans to look for life beyond Earth.”
Methane is a carbon atom bound to four hydrogen atoms. On Earth, much of it is produced biologically (flatulent cows are a classic example), but it can also be made inorganically; for example, volcanoes at the bottom of the ocean can release the gas after it is produced by reactions of rocks with seawater.
Ozone and oxygen were previously thought to be stronger biosignatures on their own. Ozone is three atoms of oxygen bound together. On Earth, it is produced when molecular oxygen (two oxygen atoms) and atomic oxygen (a single oxygen atom) combine, after the atomic oxygen is created by other reactions powered by sunlight or lightning. Life is the dominant source of the molecular oxygen on our planet, as the gas is produced by photosynthesis in plants and microscopic, single-cell organisms. Because life dominates the production of oxygen, and oxygen is needed for ozone, both gases were thought to be relatively strong biosignatures. But this study demonstrated that both molecular oxygen and ozone can be made without life when ultraviolet light breaks apart carbon dioxide (a carbon atom bound to two oxygen atoms). Their research suggests this non-biological process could create enough ozone for it to be detectable across space, so the detection of ozone by itself would not be a definitive sign of life.
“However, our research strengthens the argument that methane and oxygen together, or methane and ozone together, are still strong signatures of life,” said Domagal-Goldman. “We tried really, really hard to make false-positive signals for life, and we did find some, but only for oxygen, ozone, or methane by themselves.” Domagal-Goldman and Antígona Segura from the Universidad Nacional Autónoma de México in Mexico City are lead authors of a paper about this research, along with astronomer Victoria Meadows, geologist Mark Claire, and Tyler Robison, an expert on what Earth would look like as an extrasolar planet. The paper appeared in the Astrophysical JournalSeptember 10, 2014.
Methane and oxygen molecules together are a reliable sign of biological activity because methane doesn’t last long in an atmosphere containing oxygen-bearing molecules. “It’s like college students and pizza,” says Domagal-Goldman. “If you see pizza in a room, and there are also college students in that room, chances are the pizza was freshly delivered, because the students will quickly eat the pizza. The same goes for methane and oxygen. If both are seen together in an atmosphere, the methane was freshly delivered because the oxygen will be part of a network of reactions that will consume the methane. You know the methane is being replenished. The best way to replenish methane in the presence of oxygen is with life. The opposite is true, as well. In order to keep the oxygen around in an atmosphere that has a lot of methane, you have to replenish the oxygen, and the best way to do that is with life.”
Scientists have used computer models to simulate the atmospheric chemistry on planets beyond our solar system (exoplanets) before, and the team used a similar model in its research. However, the researchers also developed a program to automatically compute the calculations thousands of times, so they could see the results with a wider range of atmospheric compositions and star types.
In doing these simulations, the team made sure they balanced the reactions that could put oxygen molecules in the atmosphere with the reactions that might remove them from the atmosphere. For example, oxygen can react with iron on the surface of a planet to make iron oxides; this is what gives most red rocks their color. A similar process has colored the dust on Mars, giving the Red Planet its distinctive hue. Calculating the appearance of a balanced atmosphere is important because this balance would allow the atmosphere to persist for geological time scales. Given that planetary lifetimes are measured in billions of years, it’s unlikely astronomers will happen by chance to be observing a planet during a temporary surge of oxygen or methane lasting just thousands or even millions of years.
It was important to make the calculations for a wide variety of cases, because the non-biological production of oxygen is subject to both the atmospheric and stellar environment of the planet. If there are a lot of gases that consume oxygen, such as methane or hydrogen, then any oxygen or ozone produced will be destroyed in the atmosphere. However, if the amount of oxygen-consuming gases is vanishingly small, the oxygen and the ozone might stick around for a while. Likewise, the production and destruction of oxygen, ozone, and methane is driven by chemical reactions powered by light, making the type of star important to consider as well. Different types of stars produce the majority of their light at specific colors. For example, massive, hot stars or stars with frequent explosive activity produce more ultraviolet light. “If there is more ultraviolet light hitting the atmosphere, it will drive these photochemical reactions more efficiently,” said Domagal-Goldman. “More specifically, different colors (or wavelengths) of ultraviolet light can affect oxygen and ozone production and destruction in different ways.”
Astronomers detect molecules in exoplanet atmospheres by measuring the colors of light from the star the exoplanet is orbiting. As this light passes through the exoplanet’s atmosphere, some of it is absorbed by atmospheric molecules. Different molecules absorb different colors of light, so astronomers use these absorption features as unique “signatures” of the type and quantity of molecules present.
“One of the main challenges in identifying life signatures is to distinguish between the products of life and those compounds generated by geological processes or chemical reactions in the atmosphere. For that we need to understand not only how life may change a planet but how planets work and the characteristics of the stars that host such worlds”, said Segura.
The team plans to use this research to make recommendations about the requirements for future space telescopes designed to search exoplanet atmospheres for signs of alien life. “Context is key – we can’t just look for oxygen, ozone, or methane alone,” says Domagal-Goldman. “To confirm life is making oxygen or ozone, you need to expand your wavelength range to include methane absorption features. Ideally, you’d also measure other gases like carbon dioxide and carbon monoxide [a molecule with one carbon atom and one oxygen atom]. So we’re thinking very carefully about the issues that could trip us up and give a false-positive signal, and the good news is by identifying them, we can create a good path to avoid the issues false positives could cause. We now know which measurements we need to make. The next step is figuring out what we need to build and how to build it.”
The research was funded in part by the NASA Astrobiology Institute’s (NAI) Virtual Planetary Laboratory (VPL). The NAI is administered by NASA’s Ames Research Center in Mountain View, California, and funded as part of the NASA Astrobiology Program at NASA Headquarters, Washington. The VPL is based at the University of Washington, and comprises researchers at 20 institutions working to understand how telescopic observations and modeling studies can determine if exoplanets are able to support life, or had life in the past. Additional support for the research was provided by the NASA Postdoctoral Program, managed by Oak Ridge Associated Universities.
The team represented an international collaboration that included researchers from NASA Goddard, NASA Ames, the NAI/VPL, the Instituto de Ciencias Nucleares, Universidad Nacional Autónoma de México, Mexico; the University of St. Andrews, St. Andrews, Scotland; and the University of Washington, Seattle.
NASA’s Curiosity Rover Arrives at Mount Sharp

This image shows the old and new routes of NASA’s Mars Curiosity rover and is composed of color strips taken by the High Resolution Imaging Science Experiment, or HiRISE, on NASA’s Mars Reconnaissance Orbiter. This new route provides excellent access to many features in the Murray Formation. And it will eventually pass by the Murray Formation’s namesake, Murray Buttes, previously considered to be the entry point to Mt. Sharp. Image Credit: NASA/JPL-Caltech/Univ. of Arizona
After 2 years and roughly 9 kilometers of driving, NASA’s Mars Curiosity rover has arrived at the base of Mount Sharp to begin a new phase of exploration.
NASA’s Mars Curiosity rover has reached the Red Planet’s Mount Sharp, a Mount-Rainier-size mountain at the center of the vast Gale Crater and the rover mission’s long-term prime destination.
“Curiosity now will begin a new chapter from an already outstanding introduction to the world,” said Jim Green, director of NASA’s Planetary Science Division at NASA Headquarters in Washington. “After a historic and innovative landing along with its successful science discoveries, the scientific sequel is upon us.”
Curiosity’s trek up the mountain will begin with an examination of the mountain’s lower slopes. The rover is starting this process at an entry point near an outcrop called Pahrump Hills, rather than continuing on to the previously-planned, further entry point known as Murray Buttes. Both entry points lay along a boundary where the southern base layer of the mountain meets crater-floor deposits washed down from the crater’s northern rim.
“It has been a long but historic journey to this Martian mountain,” said Curiosity Project Scientist John Grotzinger of the California Institute of Technology in Pasadena. “The nature of the terrain at Pahrump Hills and just beyond it is a better place than Murray Buttes to learn about the significance of this contact. The exposures at the contact are better due to greater topographic relief.”
The decision to head uphill sooner, instead of continuing to Murray Buttes, also draws from improved understanding of the region’s geography provided by the rover’s examinations of several outcrops during the past year. Curiosity currently is positioned at the base of the mountain along a pale, distinctive geological feature called the Murray Formation. Compared to neighboring crater-floor terrain, the rock of the Murray Formation is softer and does not preserve impact scars, as well. As viewed from orbit, it is not as well-layered as other units at the base of Mount Sharp.
After 2 years of driving, NASA’s Mars Curiosity has arrived at the base of Mount Sharp.
Curiosity made its first close-up study last month of two Murray Formation outcrops, both revealing notable differences from the terrain explored by Curiosity during the past year. The first outcrop, called Bonanza King, proved too unstable for drilling, but was examined by the rover’s instruments and determined to have high silicon content. A second outcrop, examined with the rover’s telephoto Mast Camera, revealed a fine-grained, platy surface laced with sulfate-filled veins.
While some of these terrain differences are not apparent in observations made by NASA’s Mars orbiters, the rover team still relies heavily on images taken by the agency’s Mars Reconnaissance Orbiter (MRO) to plan Curiosity’s travel routes and locations for study.
For example, MRO images helped the rover team locate mesas that are over 60 feet (18 meters) tall in an area of terrain shortly beyond Pahrump Hills, which reveal an exposure of the Murray Formation uphill and toward the south. The team plans to use Curiosity’s drill to acquire a sample from this site for analysis by instruments inside the rover. The site lies at the southern end of a valley Curiosity will enter this week from the north.
Though this valley has a sandy floor the length of two football fields, the team expects it will be an easier trek than the sandy-floored Hidden Valley, where last month Curiosity’s wheels slipped too much for safe crossing.
Curiosity reached its current location after its route was modified earlier this year in response to excessive wheel wear. In late 2013, the team realized a region of Martian terrain littered with sharp, embedded rocks was poking holes in four of the rover’s six wheels. This damage accelerated the rate of wear and tear beyond that for which the rover team had planned. In response, the team altered the rover’s route to a milder terrain, bringing the rover farther south, toward the base of Mount Sharp.
“The wheels issue contributed to taking the rover farther south sooner than planned, but it is not a factor in the science-driven decision to start ascending here rather than continuing to Murray Buttes first,” said Jennifer Trosper, Curiosity Deputy Project Manager at NASA’s Jet Propulsion Laboratory (JPL) in Pasadena, California. “We have been driving hard for many months to reach the entry point to Mount Sharp,” Trosper said. “Now that we’ve made it, we’ll be adjusting the operations style from a priority on driving to a priority on conducting the investigations needed at each layer of the mountain.”
After landing inside Gale Crater in August 2012, Curiosity fulfilled in its first year of operations its major science goal of determining whether Mars ever offered environmental conditions favorable for microbial life. Clay-bearing sedimentary rocks on the crater floor, in an area called Yellowknife Bay, yielded evidence of a lakebed environment billions of years ago that offered fresh water, all of the key elemental ingredients for life, and a chemical source of energy for microbes.
NASA’s Mars Science Laboratory Project continues to use Curiosity to assess ancient habitable environments and major changes in Martian environmental conditions. The destinations on Mount Sharp offer a series of geological layers that recorded different chapters in the environmental evolution of Mars.
The Mars Exploration Rover Project is one element of NASA’s ongoing preparation for a human mission to the Red Planet in the 2030s. JPL built Curiosity and manages the project and MRO for NASA’s Science Mission Directorate in Washington.
Source: Dwayne Brown, NASA
Astronomers Measure Molecular Emission and Dust Temperatures of the Pipe Nebula

One portion of the vast dark cloud of interstellar dust called the Pipe Nebula (shown here is the object Barnard 59). The Pipe Nebula is known for being massive, and so a likely candidate for young stars, yet it is cold and dark with few signs of star formation. Astronomers have observed fifty-two dense cores in the Pipe in six key interstellar molecules using millimeter telescopes, and find clump temperatures as low as thirteen kelvin. Credit: ESO
Astronomers from the Harvard-Smithsonian Center for Astrophysics recently completed a study of the dense cores of the Pipe Nebula, revealing that the cores are very cold, between 13 and 19 kelvin, with the coldest ones containing the most obscuring dust.
The Pipe Nebula is a prominent dark molecular cloud located about 430 light-years from us. It contains about ten thousand solar-masses of material, making it one of the closest giant molecular complexes to us, and with dimensions of about 10 by 46 light-years, one of the largest. These properties should make it an excellent place to study star formation up close, except for one problem: there is very little star formation underway there. Instead, the Pipe Nebula has become one of the prime cases for testing ideas about star formation, since apparently an abundance of material is not enough by itself to produce new stars.
The Pipe Nebula is not uniform in density; it contains a large population of dense, low-mass cores, about 134 distinct objects. In other molecular clouds these cores evolve into young stars, but in the Pipe they remain quiescent. Astronomers have been using radio astronomy techniques to study the density and temperatures of particular molecular species in these cold cores, for example species of carbon monoxide and ammonia, whose relative line strengths can quantify these parameters.
CfA astronomers Jan Frobrich, Karin Oberg, and Charlie Lada, together with four colleagues, have now completed a study of fifty-two of the Pipe’s cores in the light from six additional molecules that are particularly useful in characterizing star formation activity, and also complemented that data with infrared images from Herschel that show the cold dust distribution. They report that the dense cores in the Pipe are very cold indeed, between 13 and 19 kelvin, with the coldest ones containing the most obscuring dust. The astronomers find that one molecule in particular, N2H+, is the only species to exclusively trace the very densest and coldest cores, making this molecule a key diagnostic for future studies to figure out why these dense cores do not form stars.
Publication: Jan Forbrich, et al., “Some Like It Cold: Molecular Emission and Effective Dust Temperatures of Dense Cores in the Pipe Nebula,” A&A, Volume 568, August 2014; doi:10.1051/0004-6361/201423913
Researchers Reset Human Pluripotent Stem Cells to a Fully Pristine State

A newly published study details how scientists were able to successfully ‘reset’ human pluripotent stem cells to a fully pristine state.
Researchers at EMBL-EBI have resolved a long-standing challenge in stem cell biology by successfully ‘resetting’ human pluripotent stem cells to a fully pristine state, at the point of their greatest developmental potential. The study, published in Cell, involved scientists from the UK, Germany and Japan and was led jointly by EMBL-EBI and the University of Cambridge.
Embryonic stem (ES) cells, which originate in early development, are capable of differentiating into any type of cell. Until now, scientists have only been able to revert ‘adult’ human cells (for example, liver, lung or skin) into pluripotent stem cells with slightly different properties that predispose them to becoming cells of certain types. Authentic ES cells have only been derived from mice and rats.
“Reverting mouse cells to a completely ‘blank slate’ has become routine, but generating equivalent naïve human cell lines has proven far more challenging,” says Dr Paul Bertone, Research Group Leader at EMBL-EBI and a senior author on the study. “Human pluripotent cells resemble a cell type that appears slightly later in mammalian development, after the embryo has implanted in the uterus.”
At this point, subtle changes in gene expression begin to influence the cells, which are then considered ‘primed’ towards a particular lineage. Although pluripotent human cells can be cultured from in vitro fertilized (IVF) embryos, until now there have been no human cells comparable to those obtained from the mouse.
Wiping cell memory
“For years, it was thought that we could be missing the developmental window when naïve human cells could be captured, or that the right growth conditions hadn’t been found,” Paul explains. “But with the advent of iPS cell technologies, it should have been possible to drive specialized human cells back to an earlier state, regardless of their origin – if that state existed in primates.”
Taking a new approach, the scientists used reprogramming methods to express two different genes, NANOG and KLF2, which reset the cells. They then maintained the cells indefinitely by inhibiting specific biological pathways. The resulting cells are capable of differentiating into any adult cell type, and are genetically normal.
The experimental work was conducted hand-in-hand with computational analysis.
“We needed to understand where these cells lie in the spectrum of the human and mouse pluripotent cells that have already been produced,” explains Paul. “We worked with the EMBL Genomics Core Facility to produce comprehensive transcriptional data for all the conditions we explored. We could then compare reset human cells to genuine mouse ES cells, and indeed we found they shared many similarities.”
Together with Professor Wolf Reik at the Babraham Institute, the researchers also showed that DNA methylation (biochemical marks that influence gene expression) was erased over much of the genome, indicating that reset cells are not restricted in the cell types they can produce. In this more permissive state, the cells no longer retain the memory of their previous lineages and revert to a blank slate with unrestricted potential to become any adult cell.
Unlocking the potential of stem cell therapies
The research was performed in collaboration with Professor Austin Smith, Director of the Wellcome Trust-Medical Research Council Stem Cell Institute.
“Our findings suggest that it is possible to rewind the clock to achieve true ground-state pluripotency in human cells,” said Professor Smith. “These cells may represent the real starting point for formation of tissues in the human embryo. We hope that in time they will allow us to unlock the fundamental biology of early development, which is impossible to study directly in people.”
The discovery paves the way for the production of superior patient material for translational medicine. Reset cells mark a significant advance for human stem cell applications, such as drug screening of patient-specific cells, and are expected to provide reliable sources of specialized cell types for regenerative tissue grafts.
‘Hot Jupiters’ Can Force Their Host Stars to Wobble

A new study from Cornell University shows that when the “Hot Jupiters” approach their host star, the planet can force the star’s spin axis to precess much like a wobbling, spinning top.
According to new Cornell research published in Science, these large, gaseous exoplanets can make their suns wobble after they wend their way through their own solar systems to snuggle up against their suns.
“Although the planet’s mass is only one-thousandth of the mass of the sun, the stars in these other solar systems are being affected by these planets and making the stars themselves act in a crazy way,” said Dong Lai, Cornell professor of astronomy and senior author on the research, “Chaotic Dynamics of Stellar Spin in Binaries and the Production of Misaligned Hot Jupiters.” Physics graduate student Natalia I. Storch (lead author) and astronomy graduate student Kassandra R. Anderson are co-authors.
In our solar system, the sun’s rotational axis is approximately aligned with the orbital axis of all the planets. The orbital axis is perpendicular to the flat plane in which the planets revolve around the sun. In solar systems with hot Jupiters, recent observations have revealed that the orbital axis of these planets is misaligned with the rotational axis of their host star. In the last few years, astronomers have been puzzled by spin-orbit misalignment between the star and the planets.
Roasting like marshmallows on an open fire, hot Jupiters – large gaseous planets found throughout the universe in other solar systems – wander from distant places to orbit extraordinarily close to their own suns. So far as astronomers know, this only happens in binary star systems. Partner binary stars, some as far away as hundreds of astronomical units (an astronomical unit is 93 million miles, the distance between Earth and the sun), influence the giant Jupiter-like planets through gravity and cause them to falter into uncommon orbits; that, in turn, causes them to migrate inward close to their sun, Lai said.
“When exoplanets were first found in the 1990s, it was large planets like Jupiter that were discovered. It was surprising that such giant planets can be so close to the parent star,” Lai said. “Our own planet Mercury is very close to our sun. But these hot Jupiters are much closer to their suns than Mercury.”
By simulating the dynamics of these exotic planetary systems, the Cornell astronomers showed that when the Jupiter-like planet approaches its host star, the planet can force the star’s spin axis to precess (that is, change the orientation of their rotational axis), much like a wobbling, spinning top.
“Also, it can make the star’s spin axis change direction in a rather complex – or even a chaotic – way,” said Lai. “This provides a possible explanation to the observed spin-orbit misalignments and will be helpful for understanding the origin of these enigmatic planets.”
Lai noted that the chaotic variation of the star’s spin axis resembles other chaotic phenomena found in nature, such as weather and climate.
The research was supported by the National Science Foundation and by NASA.
Publication: Natalia I. Storch, et al., “Chaotic dynamics of stellar spin in binaries and the production of misaligned hot Jupiters,” Science 12 September 2014: Vol. 345 no. 6202 pp. 1317-1321; DOI: 10.1126/science.1254358
Subscribe to:
Posts (Atom)